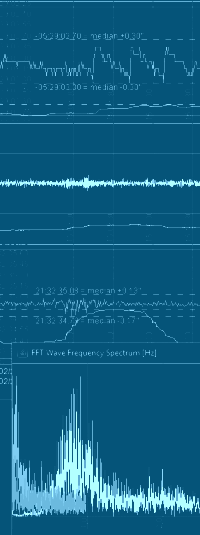
FITSalize Figure 1: FITSalize after a succesfull run at the command-line. FITSalize is a small command-line toll that analyses a number of FITS-images. From these file the following information is deduced:FITSalize v.1.23 can be downloaded here. The changelog is at the bottom of this page. In order to do its work FITSalize depends on the Astrometric STAcking Program ASTAP. The ZIP-file contains the following: - cmd.bat: double-click this file to start a CMD-terminal; - fits.jar: library for reading FITS headers; - FITSalize.bat: batch-file to run FITSalize. It need the FITS location as a parameter; - FITSalize.ini: Preference file containing settings; - FITSalize_v1.23.ods: OpenOffice Calc spreadsheet for creating graphs; - FITSalize_v1.23.xls: Microsoft Excel spreadsheet for creating graphs (Export of FITSalize_v1.1.ods). FITSalize Set-up Figure 2: The FITSalize INI-file. In the FITSalize.ini file various options can be set. The location of ASTAP installation can be set after the line [ASTAP path], see adjacent image for the default location. The option [Timestamp is (start,middle,end) of exposure] defines the reference for the imaging moment, so whether the timestamp in the FITS header is the start, the middle or the end of the image capture. Suppose we start to image at 10:05:15.0pm with an exposure-time of 3 seconds, the FITS-image will show the sky as it was at 10:05:16.5pm. The FITS-header may, however, have stored the start of the exposure as observation time. Setting the Timestamp to "start", half the exposure time is automatically added to the times found in the FITS headers. Setting it to "end" will subtract this amount. Any other setting will cause it not to correct the times. The [Disable Aberration (yes/no)] setting allows to do the calculations without aberration. This can be useful when comparing the calculations to Stellarium as Stellarium does not apply aberration. As FITSalize does not apply proper motion to the calculations a star with limited proper motion should be selected in Stellarium. The [Export failed plate-solves (yes/no)] option allows to only export those files that were solved. When set to "yes" it will output data for each FITS, but only show data for those columns that require a successful plate-solve. For deformation and SQM measurements it is recommended to have the option set to "no" to avoid empty rows in the Alt/Azi and SQM columns. For focuser gradients it is best to have it at "yes". All data is stored in a .CSV-file which can easily be opened in OpenOffice or Excel (two example files are provided). The [Decimal sign] option allows to set the character for decimal symbol as used in the output file for those who have a locale that does not use a dot as decimal sign. The output file starts with a header-line explaining which data resides in which column. A description of the header can be found below. The output file ends with four lines stating at which date/time the processing was done, how many files were processed from which folder, how many were plate-solved and stored, and which FITSalize version was used. Deformation measurement set-up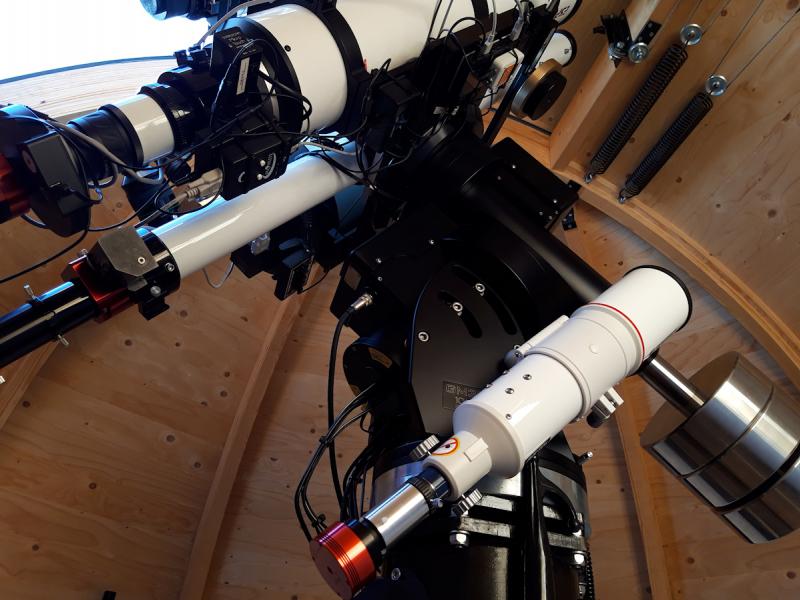 Figure 3: Bresser 90/500 with ZWO ASI174MM fixated to the pier. For my test I recorded a single 3 second exposure image every 60 seconds using NINA. In order to have the correct longitude and latitude in the FITS header a mount has to be selected and active in NINA. For the deformation measurements the simulator mount can be used for this purpose. Simply select it, check if latitude and longitude are properly and accurately set and slew the mount using the virtual controller to approximately the right location in altitude and azimuth (say within 10 degrees). Once all images are taken, open one in ASTAP and load one of the FITS to see if it solves. If not, check if image height is correctly set in ASTAP (Stack-menu -> Alignment tab -> Field of view (height)) and set the Radius search area to 90 degrees (at the same tab). Check if ASTAP now does solve the FITS, and if so, ASTAP can be closed. Double-click the cmd.bat file and type the following command: FITSalize.bat [path to FITS files] The path can be realtive (e.g. ../data/lights) or absolute (e.g. Z:/data/lights), but UNC paths are not allowed (e.g. \\data\lights). Once FITSalize is ready the output file can be opened in your favourite spreadsheet. For convenience OpenOffice and Microsoft Office spreadsheet are supplied in the zip-file. Simply copy the data from the output-file and paste it in the spreadsheet in the tab "Paste data here", starting from cell A1. The other tabs will show the graphs. The Microsoft Excel version of the sheet was exported from OpenOffice Calc version and is bound to be poorly formatted. Astro set-up deformation Figure 4: Deformation measurement graph of the InFINNity Deck pier from FITSalize. When doing unguided imaging like I do, it is of utmost importance that the mount is set-up in a stable way. Deformation of the set-up may not lead to high eccentricities and should thus be kept low in relation to the FWHM. Suppose we are imaging with a FWHM of 4 arc-seconds and we want to keep eccentricity below 0.5, the allowed deformation is 0.6 arc-seconds at the most. When imaging in narrow-band I take 420 seconds exposures. This means the allowed deformation in my set-up is 3600 / 420 x 0.6 = 5 arc-seconds per hour. In order to measure the actual deformation it is best to fixate a small scope to the base of the pier (or tripod) and to point it at a fixed orientation in altitude and azimuth. For InFINNity Deck I used a Bresser Messier 90/500 f/5.5 achromatic refractor with a ZWO ASI174MM camera @ 300 gain and 3s exposure. Time is of the essence! So either configure Windows Time Synch (w32tm) or Meinberg NTP Package. Stellarium comparison Figure 5: Comparison with Stellarium shows that Stellarium does not use aberration. I have used Stellarium during the implementation of the algorithms to test FITSalize. Already at an early stage I found out that Stellarium did not have aberration included in the calculations. So in order to allow others to do same same comparison, the aberration can be disabled via the ini-file. Adjacent image shows the conversion of Al Jabhah, a star with limited proper motion. The J2000 coordinates are shown in green, the nutation in blue and the JNOW coordinates in red. The mean coordinates (as affected by precession) are not shown in the terminal. As aberration is disabled the corrections for aberration are showing as zeros in the purple rectangle. Focuser gradient Figure 6: Focuser gradients based on ambient and focuser temperatures of two imaging nights. Astrophotography packages like NINA and SGP allow focuser adjustment based on temperature. For this one needs to know the required gradient. Usually the acquisition software can determine the gradient overnight while imaging. FITSalize can determine the gradient based on historic data, which allows to base the gradient on a much larger dataset and covering a larger temperature scale than what could normally achieved during a single night of imaging. If the imaging system is interfaced to a weather station and a focuser temperature gauge, the gradients are calculated for both temperature sources. Adjacent figure shows the focuser gradients for two night nights while imaging two targets per night. The gradients for both methods are nearly identical, each being just over 13 steps per degree centigrade (the focuser is using a 1:16 planetary gear and MicroTouch focus motor). Being two sensors at different locations cause the intercept to differ from each other. SQM measurements Figure 7: SQM plotted against azimuth shows which parts of the sky have the least light pollution. As FITSalize logs a wide variety of parameters, one of which being the SQM-values as determined by ASTAP. As also time and azimuth are logged there are at least two ways to present the data. Plotting SQM against time allows to see if one needs to start imaging later or to stop imaging earlier than anticipated. Plotting the SQM-values against azimuth allows to see which parts are least affected by light pollution as can be seen in adjacent image. The town centre is to the north-east of the observatory and indeed the lowest SQM-values are recorded in that direction. Output file headers
ChangelogChanges made since the tool became available: 220401 - v.1.23: Writing empty cells instead of zeros to output file for those fields that require a successful plate-solve. Added option to INI file to not store unsolved FITS in output file; Replaced the running dots by a rotator to indicate progress; Added FITS folder to the end of the output file; Added processing stats to the end of the output file. 220401 - v.1.22: Addition of non-standard "UTC" keyword; Added one header line to the output file showing version of FITSalize and creation date/time. 220401 - v.1.21: For pressure AOCBAROM is used when PRESS and PRESSURE are not available in the FITS-header; Takes FOCTEMP as temperature for the refraction calculation when AMBTEMP is zero (and vice versa); Exporting refraction to spreadsheet; Removed bug from spreadsheet (in calculation tab columns C and D referenced to one line above); Added column for refraction to spreadsheet. 220331 - v.1.2: Fixed bug in calculation of Nutation in Longitude of the Ecliptic; Calculations of nutation and the obliquity of the ecliptic are now based on JDE instead of JD; Improved output to console (Number of lines now match standard console, degrees sign now properly shows); Allowed changing decimal sign from dot to comma via the ini-file; Spreadsheets have same versioning as main program. If you have any questions and/or remarks please let me know. |
InFINNity Deck... Astrophotography... Astro-Software... Astro Reach-out... Equipment... White papers...
ASCOM Envir. SafetyMonitor ASCOM File SafetyMonitor ASCOM Generic UPS driver ASCOM IP SafetyMonitor ASCOM SafetyMonitor Hub Astronomical Twilight FITSalize Log10mGrabber MountCMD MountMonitor PySpectrometer3